How to Configure Advanced Diagnostic Data Upload Schedules in Windows 11

Advanced diagnostic data upload schedules in Windows 11 let you control when your computer sends system error reports and usage data to Microsoft. By default, the Connected User Experiences and Telemetry service (a background tool that sends diagnostic files to Microsoft) uploads this information whenever your PC has an active internet connection and sits idle.
Changing these schedules gives you tighter control over network traffic and power use. You can push uploads into specific maintenance windows or hold them back while you are on a metered internet connection. This guide covers the diagnostic data level first, then the scheduling controls, then how to check that everything took effect.
Open Settings Privacy & security Diagnostics & feedback, then expand Diagnostic data and toggle Send optional diagnostic data on or off to set your level. Use Group Policy Editor or Task Scheduler to configure upload timing through the Connected User Experiences and Telemetry service settings.
Diagnostic Data Levels and Their Impact on Upload Frequencies
The diagnostic data level decides how much information your computer sends to Microsoft, and that in turn affects how often and how much it uploads. Moving between required and optional telemetry changes the size of the data packets queued for transmission. That affects your network bandwidth and your privacy position.
- Off: Disables optional and required diagnostic data collection, so routine telemetry generation stops. Basic security reporting may still function depending on enterprise configuration. This level is normally only available through policy on Enterprise and Education editions, so you will not see it as a choice in Settings on Home or Pro.
- Required Diagnostic Data: Gathers basic device information, settings, capabilities, and whether apps are performing correctly. This tier produces smaller payloads and less frequent upload queues.
- Optional Diagnostic Data: Includes deeper device telemetry, website activity, enhanced error reporting, and crash dumps. This setting generates significantly larger data packets that need more frequent or larger upload windows.
Because each tier changes how much data is waiting to go out, a higher setting needs stricter scheduling. Without it, background uploads can saturate the connection during peak business hours.
How Microsoft Handles Diagnostic Data Transmission
Windows sends diagnostic data as encrypted logs over secure HTTPS connections to Microsoft’s official data collection endpoints. The Connected User Experiences and Telemetry service manages these payloads in the background. It holds them locally until your device has an active internet connection.
Managing this transmission lifecycle prevents network congestion. In enterprise and high-security environments, administrators often pair custom upload schedules with proxy server configurations and URL exclusions. That way telemetry traffic goes through specific gateways and does not expose internal network topology.
Diagnostic Data Settings in 🪟 Windows 11
Before you build an advanced schedule, set the core diagnostic data level to match your privacy and operational requirements. You can do this on a single machine through the Settings app, or enforce it across many machines with centralized management tools. If a policy is enforced, the Settings app will usually show the option greyed out with a note that some settings are managed by your organization.
Configuring Diagnostic Data via the Settings App
The Settings app lets you switch between required and optional diagnostic data using the built-in menus. No advanced tools are needed, and this works on both Home and Pro editions. You can reverse the change at any time by repeating the steps and choosing the other setting. No restart is required.
- Press Windows Key + I to open Settings.
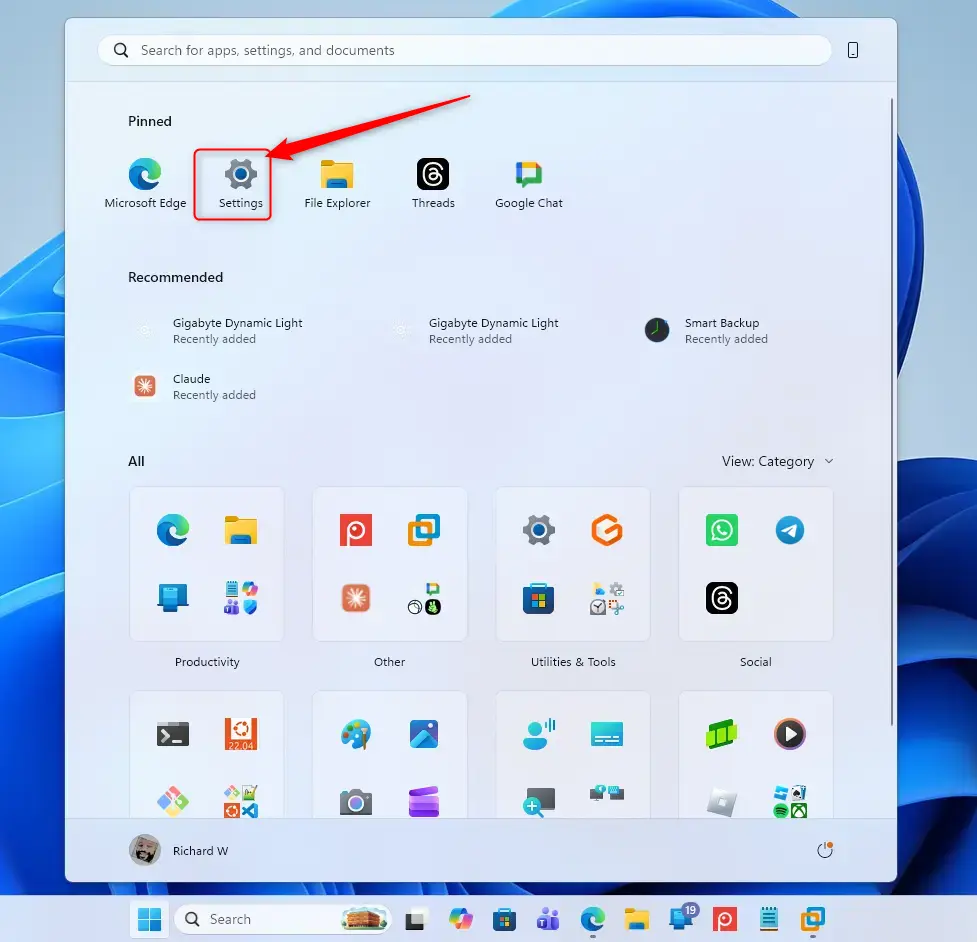
Windows 11 Start menu with Settings gear icon highlighted. - Click Privacy & security in the left-hand navigation pane.

- Scroll down the main window and select Diagnostics & feedback.
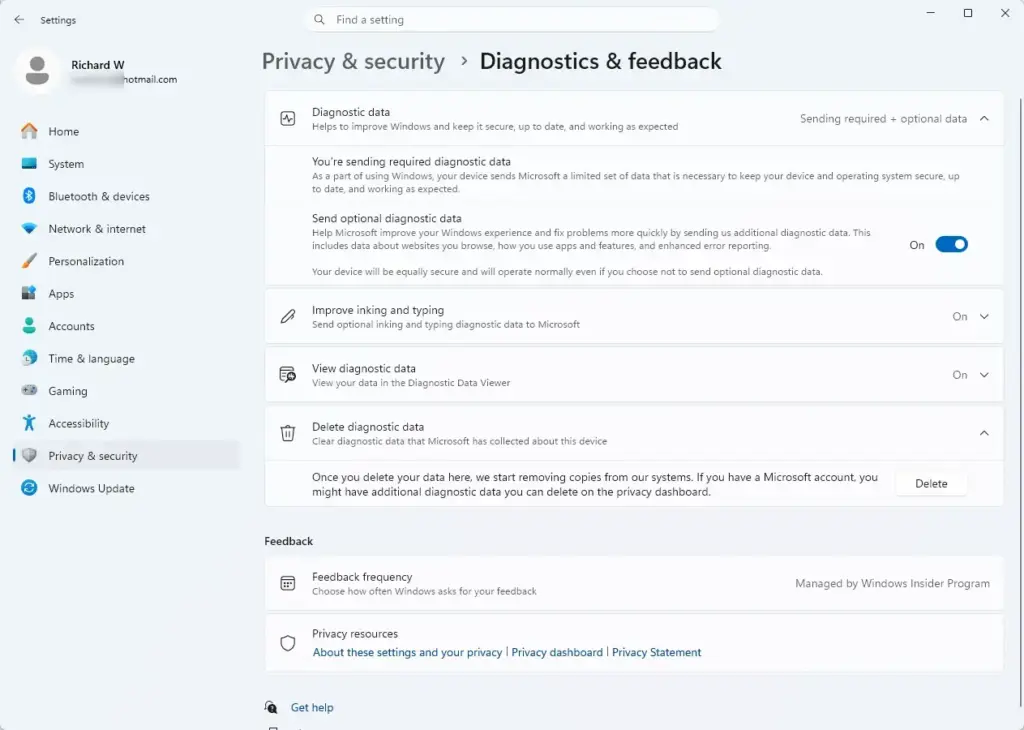
- Expand the Diagnostic data section. You should see the diagnostic data options listed under it.
- Choose between Send optional diagnostic data and the required-only setting by switching the option on or off. In current Windows 11 builds this is a toggle: turning Send optional diagnostic data off leaves you on required diagnostic data. On an older build you may see radio buttons instead.
Use Group Policy to Manage Diagnostic Data Collection
Group Policy lets you enforce a specific diagnostic data state using the Local Group Policy Editor. This administrator tool locks the telemetry level so standard users cannot change it in the Settings app. The Local Group Policy Editor is not included in Windows 11 Home. If the command in step 1 finds nothing, you are most likely on Home and should use the Settings app instead.
- Open the Start menu, type
gpedit.msc, and press Enter to launch the Local Group Policy Editor. - In the left directory tree, go to Computer Configuration Administrative Templates Windows Components Data Collection and Preview Builds.
- Double-click the policy named Allow Diagnostic Data in the central pane. The policy configuration window opens.
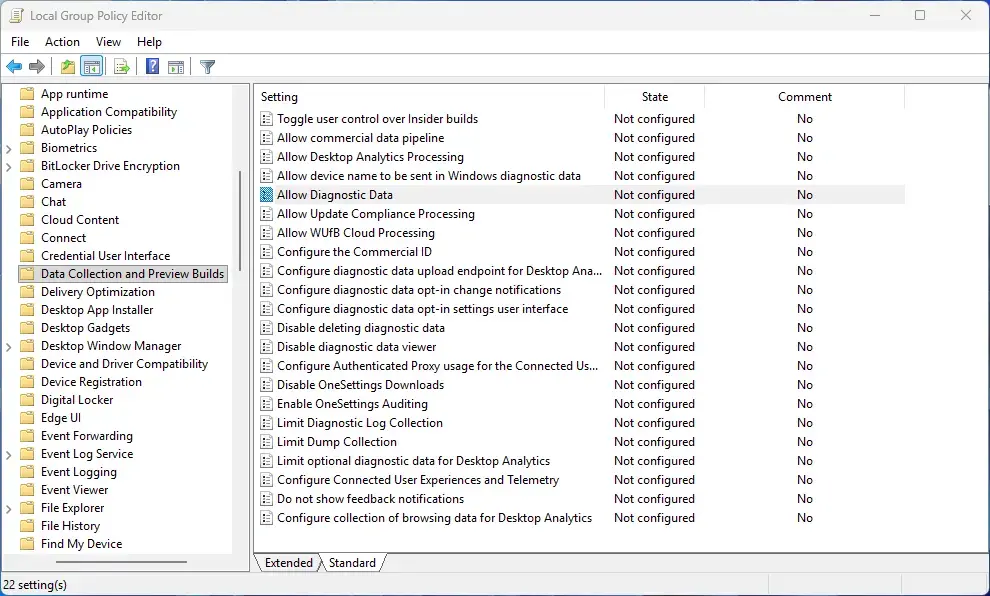
- Select Enabled in the top-left corner of the window. The Options area becomes active.
- Use the Options drop-down list to select your desired telemetry level, such as Send required diagnostic data or Send optional diagnostic data.
- Click Apply, then OK, to save your changes.
To undo this, reopen the policy and select Not Configured. Policy changes normally apply within a short time, and a restart is not usually needed. If you want to be sure, restart the PC.
Use Group Policy to Manage Optional Diagnostic Data Collection
The same Group Policy Editor location lets you restrict or permit extra telemetry transmission. Locate the right policy under the administrative templates to control whether optional data leaves your machine. Policy names differ between Windows 11 builds, so read the description text in each policy window before you change anything.
- Open the Local Group Policy Editor by typing
gpedit.mscin the Start menu search and pressing Enter (requires administrator privileges). - Go to Computer Configuration Administrative Templates Windows Components Data Collection and Preview Builds.
- Locate and double-click the policy titled Disable OneSettings Auditing, or look for advanced telemetry throttling policies, depending on your exact Windows 11 build. If a policy is not listed on your build, it is not available there.
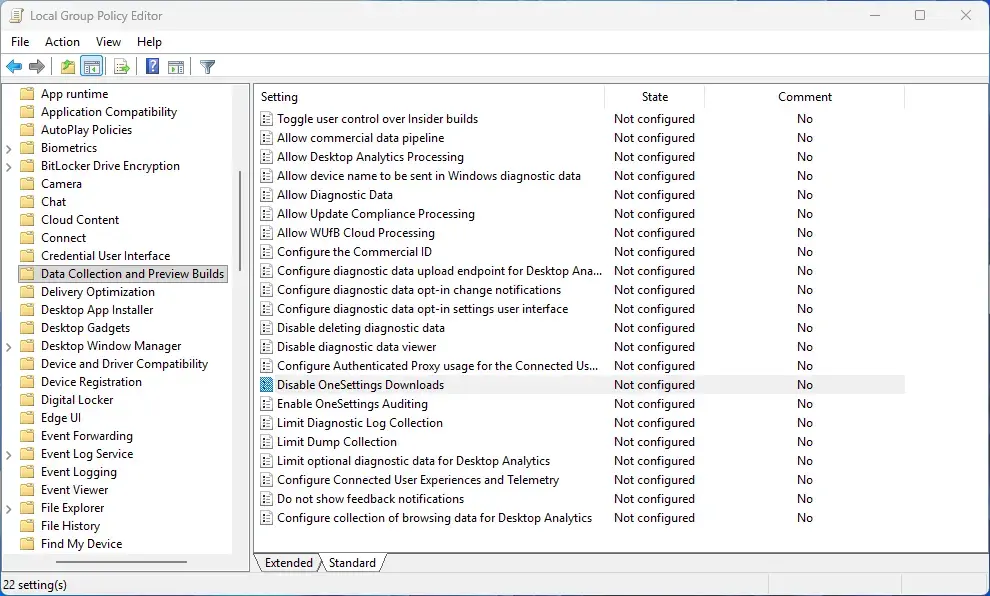
- Set the policy state to Enabled or Disabled, based on whether you want to permit supplementary data uploads. The description box in the policy window explains what each state does for that specific policy.
- Click Apply, then click OK.
To reverse the change, set the policy back to Not Configured.
Advanced Diagnostic Data Scheduling and Throttling (Unique Expert Strategy)
Advanced scheduling and throttling use Task Scheduler together with background service restrictions to control upload times and bandwidth use. Windows normally handles these bursts automatically, but you can adjust the underlying tasks for tighter control.
To restrict when diagnostic payloads are uploaded and keep them from consuming network resources during critical operational hours, you can modify the execution windows of these background maintenance tasks (requires administrator privileges). Note down the original trigger and condition values before you change them, so you can restore them later.
- Open the Start menu, type
Task Scheduler, and press Enter. Approve the User Account Control prompt if one appears. - In the left pane, expand the tree to Task Scheduler Library Microsoft Windows Customer Experience Improvement Program. The tasks in that folder appear in the top-middle pane.
- Click individual tasks such as
ConsolidatororUsbCeipto view their properties in the lower pane. - Switch to the Triggers tab to see when the task is scheduled to run.
- Double-click an active trigger to open its edit window, then change the start time to off-peak hours (such as midnight or weekends).
- Switch to the Conditions tab and select Start the task only if the computer is idle and Start only if the following network connection is available. In the connection drop-down, pick the specific unmetered network you want rather than Any connection, so the task does not run on a metered link and use data unintentionally.
- Click OK to save the modified task schedule.
Changing these tasks also does not necessarily change when the Connected User Experiences and Telemetry service itself uploads, which is why the verification steps below matter. To undo, restore the trigger and condition values you noted earlier.
Validating Diagnostic Data Configurations
Validation confirms that your custom schedules and policy changes are being applied by the operating system. You can check telemetry activity in Event Viewer by reviewing the operational logs.
- Open the Start menu, type
Event Viewer, and press Enter. - In the left sidebar, expand Applications and Services Logs Microsoft Windows and look for the telemetry-related folder with an Operational log inside it.
- Open the Microsoft-Windows-Telemetry/Operational log and review the events for successful uploads, transmission errors, and schedule execution receipts. If this log is missing or empty on your build, telemetry activity may not be logged there, and you should rely on the Task Scheduler history and policy checks instead.
- Compare the event timestamps with the off-peak schedule you set in Task Scheduler. Uploads that land outside your window mean something else is triggering them.
If this didn't work
If your settings do not stick, check whether domain-level Group Policies or MDM overrides are overwriting your local settings. A Resultant Set of Policy report, run from the command line, shows which policy source wins for each setting and helps isolate conflicts. Once your configuration applies cleanly, the next steps are to monitor network bandwidth utilization or to add advanced firewall rules that further isolate diagnostic traffic endpoints.
Was this guide helpful?

About the Author
Richard
Tech Writer, IT Professional
Richard is a writer at Geek Rewind who turns complex IT tasks into clear, step-by-step guides. He draws on years of hands-on experience in system administration and enterprise IT operations, focusing on Windows, Linux and WordPress: the problems people actually run into, and the fixes that work. His server and WordPress guides come from systems he runs himself. Richard builds and maintains the platform behind Geek Rewind, from its Ubuntu servers and Nginx configuration to its custom WordPress plugins. Many new tutorials start with readers' questions, and he's always glad to answer them in the comments.

No comments yet — be the first to share your thoughts!