How to Create Live Kernel Dumps in Windows 11


Live kernel dumps in Windows 11 capture your computer’s core memory while Windows is running so you can troubleshoot tricky crashes without restarting your PC. This diagnostic snapshot freezes system activity at a precise moment to record data about hard-to-find errors, such as bug check code 0x161.
You can use these memory files to find out why your system is unstable and track down problems with hardware parts like your graphics driver.
Create a live kernel dump by opening Task Manager , navigating to the Details tab, right-clicking an empty space, and selecting “Create live kernel dump file.” The dump file is saved in 📁C:\
How to Create a Live Kernel Dump
Making a live kernel dump in Windows 11 lets you save a snapshot of your system memory to troubleshoot freezing or crashing issues without forcing your computer to reboot. You can do this quickly by using Task Manager while your PC is still running, which saves the current state of Windows for later analysis.
- Open Task Manager by pressing Ctrl+Shift+Esc on your keyboard.
- Click on the Details tab.
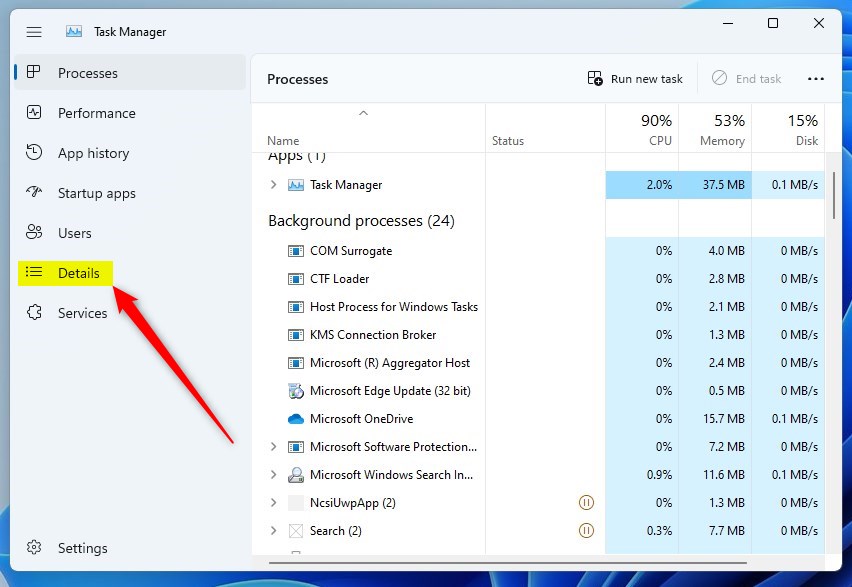
windows 11 task manager details - Right-click on any empty space in the list of processes.
- Select Create live kernel dump file.
- Choose either Full live kernel dump or Kernel stacks dump.
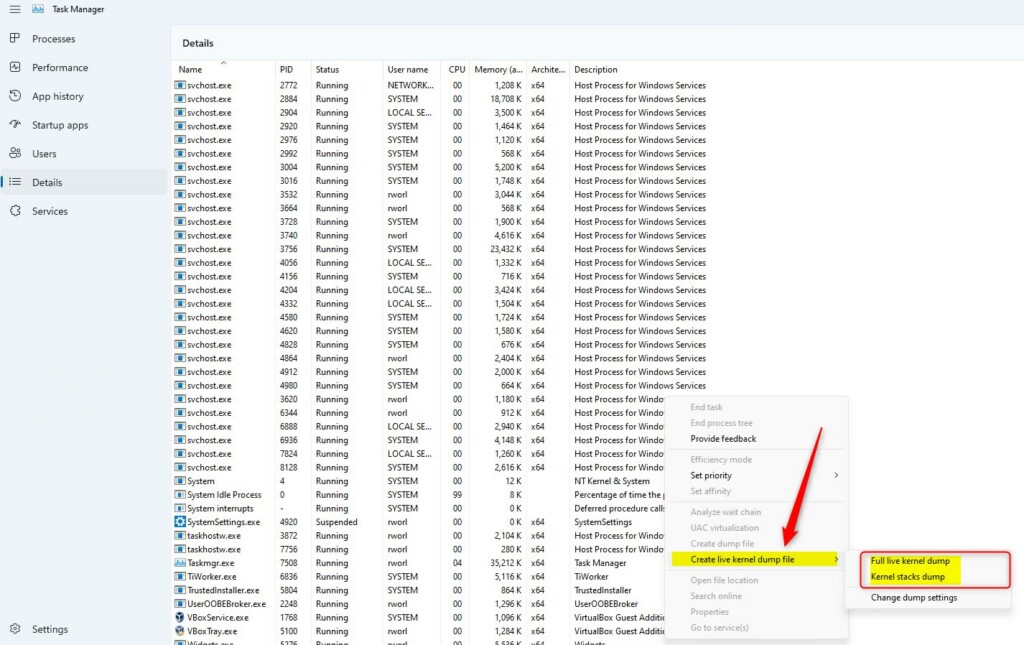
windows 11 create live kernel dump file - A box will appear showing you where the file was saved.
- Click OK to close the box.
- Click Open file location to go to the folder where the dump file is saved in 📁C:\
Windows\ .System32\ LiveKernelReports
Advanced Methods: Command-Line and Tools
Beyond Task Manager , you can use advanced debugging tools. The ProcDump utility from the Sysinternals suite is a powerful alternative. You can also use the Windows Error Reporting (WER) service to trigger these dumps manually. For deep analysis, professionals use WinDbg to inspect the memory dump file location.
Analysis and Debugging
Once you have the file, you need to analyze it. You can open the .dmp file in WinDbg. This allows you to run commands to see which driver or process caused the system to hang. Refer to the official Microsoft documentation for advanced debugging resources.
Summary
A live kernel dump in Windows 11 lets you grab important system information while your computer is still working, helping you fix problems without needing a full restart.Where are live kernel dumps stored by default in 🪟 Windows 11?
You must have administrative rights to access this directory and view the generated memory dump files. Always check this specific path if you are looking for recent snapshots created by the system or manual triggers.
Was this guide helpful?

About the Author
Richard
Tech Writer, IT Professional
Richard is a writer at Geek Rewind who turns complex IT tasks into clear, step-by-step guides. He draws on years of hands-on experience in system administration and enterprise IT operations, focusing on Windows, Linux and WordPress: the problems people actually run into, and the fixes that work. His server and WordPress guides come from systems he runs himself. Richard builds and maintains the platform behind Geek Rewind, from its Ubuntu servers and Nginx configuration to its custom WordPress plugins. Many new tutorials start with readers' questions, and he's always glad to answer them in the comments.



No comments yet — be the first to share your thoughts!