This brief tutorial shows students and new users how to install and configure the Grafana monitoring and analytics platform on Ubuntu 16.04 | 18.04 LTS servers.
Grafana is a powerful and popular open-source platform for monitoring and analyzing data from diverse systems and databases, and it runs on all major operating systems, including Ubuntu.
Grafana on Ubuntu Linux allows users to easily monitor and analyze data from various sources on a single platform. With Grafana, users can create dashboards and visualize data in real-time, making it an essential tool for system administrators, developers, and analysts.
Moreover, Grafana is backed by a vibrant community that constantly updates and enhances its functionality, making it a reliable solution for enterprise-grade monitoring and analytics.
For more about Grafana, please visit its homepage.
Install Grafana Package
To install Grafana, you can download its .deb package file and install it locally on the Ubuntu server. However, if you want to quickly and easily upgrade to newer software versions, you will want to add its official APT repository to Ubuntu.
To add its APT repository to Ubuntu, run the commands below to import its repository GPG key.
curl https://packages.grafana.com/gpg.key | sudo apt-key add -
After importing the repository key above, run the commands below to add its repository.
For its stable version, run the commands below:
echo "deb https://packages.grafana.com/oss/deb stable main" | sudo tee /etc/apt/sources.list.d/grafana.list
For its beta version, run the commands below. However, the beta version is not recommended for production, so you’ll probably use it in a non-production environment.
echo "deb https://packages.grafana.com/oss/deb beta main" | sudo tee /etc/apt/sources.list.d/grafana_beta.list
After adding the repository file above, run the commands below to update the APT package list and install Grafana packages:
sudo apt update
sudo apt-get install apt-transport-https grafana
Once installed, the commands below can stop, start, and enable Grafana to automatically startup when the server boots up.
sudo systemctl stop grafana-server.service
sudo systemctl start grafana-server.service
sudo systemctl enable grafana-server.service
Configure Grafana Service
Grafana default configuration files are under the/etc/default/grafana-server/ directory. The main configuration file is /etc/grafana/grafana.ini, which has a basic setup configured. You’ll need to make some changes to suit your environment.
To validate if Grafana is installed, run the commands below:
systemctl status grafana-server.service
You should see Grafana system status details as shown below:
● grafana-server.service - Grafana instance
   Loaded: loaded (/usr/lib/systemd/system/grafana-server.service; enabled; vendor preset: enabled)
   Active: active (running) since Wed 2019-03-06 11:00:12 CST; 21s ago
     Docs: http://docs.grafana.org
 Main PID: 6985 (grafana-server)
    Tasks: 10 (limit: 4663)
   CGroup: /system.slice/grafana-server.service
           └─6985 /usr/sbin/grafana-server --config=/etc/grafana/grafana.ini --pidfile=/var/run/graf

Mar 06 11:00:12 ubuntu1804 grafana-server[6985]: t=2019-03-06T11:00:12-0600 lvl=info msg="Initializi
Mar 06 11:00:12 ubuntu1804 grafana-server[6985]: t=2019-03-06T11:00:12-0600 lvl=info msg="Initializi
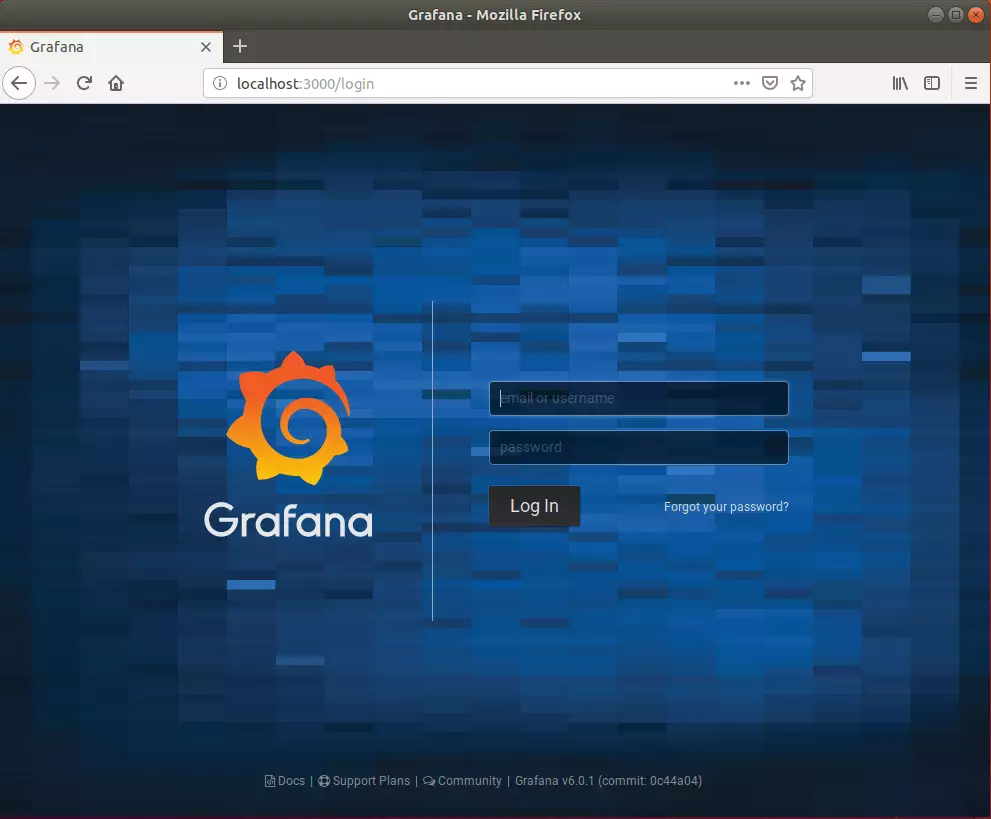
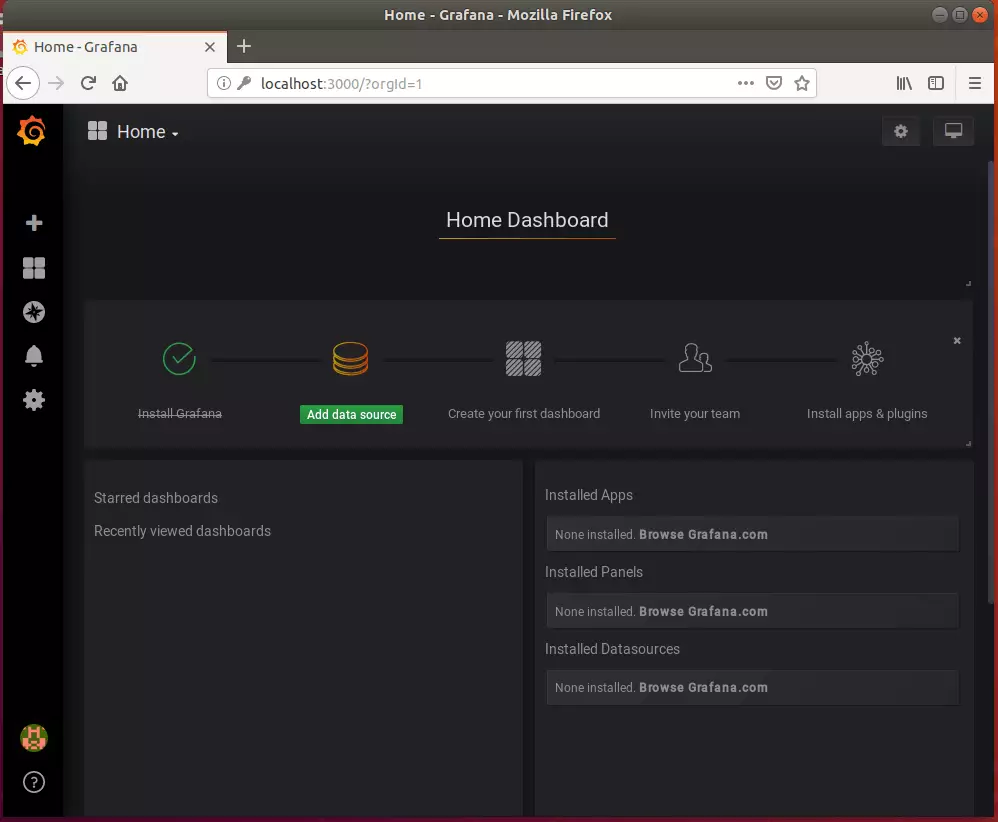
Access the Grafana Web Portal
Now that the Grafana server has been installed and access is allowed from the local machine use the address below to access the Grafana portal.
http://localhost:3000
The initial username and password are admin and admin. You’ll be prompted immediately upon entering to change the password. Enter and confirm a new password and continue.
Enjoy!
That’s it!
Congratulations! You have learned how to install the Grafana monitoring and analytics platform on Ubuntu 16.04 | 18.04 LTS servers.
You may also like the post below:


Leave a Reply