
This brief tutorial shows students and new users how to install the ELK Stack on Ubuntu. ELK is an acronym for Elasticsearch, Logstash, Kibana, and Beats.
Elasticsearch is a search engine that provides a distributed, multitenant-capable full-text search engine and schema-free JSON documents across distributed shared storage.
Logstash is a free and open server-side data processing component that collects, parses, and transforms data before sending it to other sources, including Elasticsearch.
Kibana is a free and open user interface that lets you explore and visualize Elasticsearch data. Beats are lightweight transport agents that collect application data and send it to Elasticsearch or another platform.
When you add all these components and services, you can build a robust search and analytic platform to run your services.
To get started installing the ELK stack on Ubuntu, follow the steps below:
Prepare Ubuntu
Before installing any of the services above, run the commands below on your Ubuntu machine to install packages vital to installing ELK on Ubuntu.
sudo apt update
sudo apt install wget apt-transport-https curl gnupg2
Install Java
Elasticsearch is a Java component and requires Java to be installed. The open-source version of Java should work great with Elasticsearch.
Simply run the commands below to install Java.
sudo apt install openjdk-11-jdk
To verify that Java is installed, run the commands below:
java -version
That should display similar lines as shown below:
openjdk version "11.0.10" 2021-01-19
OpenJDK Runtime Environment (build 11.0.10+9-Ubuntu-0ubuntu1.20.04)
OpenJDK 64-Bit Server VM (build 11.0.10+9-Ubuntu-0ubuntu1.20.04, mixed mode, sharing)
The commands above install OpenJDK version 11.
Install Elasticsearch
Now that Java is installed, run the commands below to add the Elasticsearch APT repository to Ubuntu since its packages are unavailable by default.
Run the commands below to add its GPG repository key.
wget -qO - https://artifacts.elastic.co/GPG-KEY-elasticsearch | sudo apt-key add -
Then, follow that by creating its repository file in Ubuntu.
echo "deb https://artifacts.elastic.co/packages/7.x/apt stable main" | sudo tee -a /etc/apt/sources.list.d/elastic-7.x.list
That should create a repository file called elastic-7.x.list.
Once the repository is added, run the commands below to install Elasticsearch.
sudo apt update
sudo apt install elasticsearch
Start and enable Elasticsearch services.
sudo systemctl start elasticsearch
sudo systemctl enable elasticsearch
By default, Elasticsearch should be running on port 9200. Run the commands below from the command line to view Elasticsearch status and details
curl -X GET "localhost:9200"
That should output similar lines as shown below:
{
  "name" : "ubuntu2004",
  "cluster_name" : "elasticsearch",
  "cluster_uuid" : "O1zUDFjJQzyjAaiP5xlwOg",
  "version" : {
    "number" : "7.12.0",
    "build_flavor" : "default",
    "build_type" : "deb",
    "build_hash" : "78722783c38caa25a70982b5b042074cde5d3b3a",
    "build_date" : "2021-03-18T06:17:15.410153305Z",
    "build_snapshot" : false,
    "lucene_version" : "8.8.0",
    "minimum_wire_compatibility_version" : "6.8.0",
    "minimum_index_compatibility_version" : "6.0.0-beta1"
  },
  "tagline" : "You Know, for Search"
}
Install Kibana
Kibana packages are available in Ubuntu repositories by default—no need to add extra repositories. Simply run the commands below to install, start, and enable Kibana services.
sudo apt install kibana
sudo systemctl start kibana
sudo systemctl enable kibana
That should get Kibana installed and ready to use.
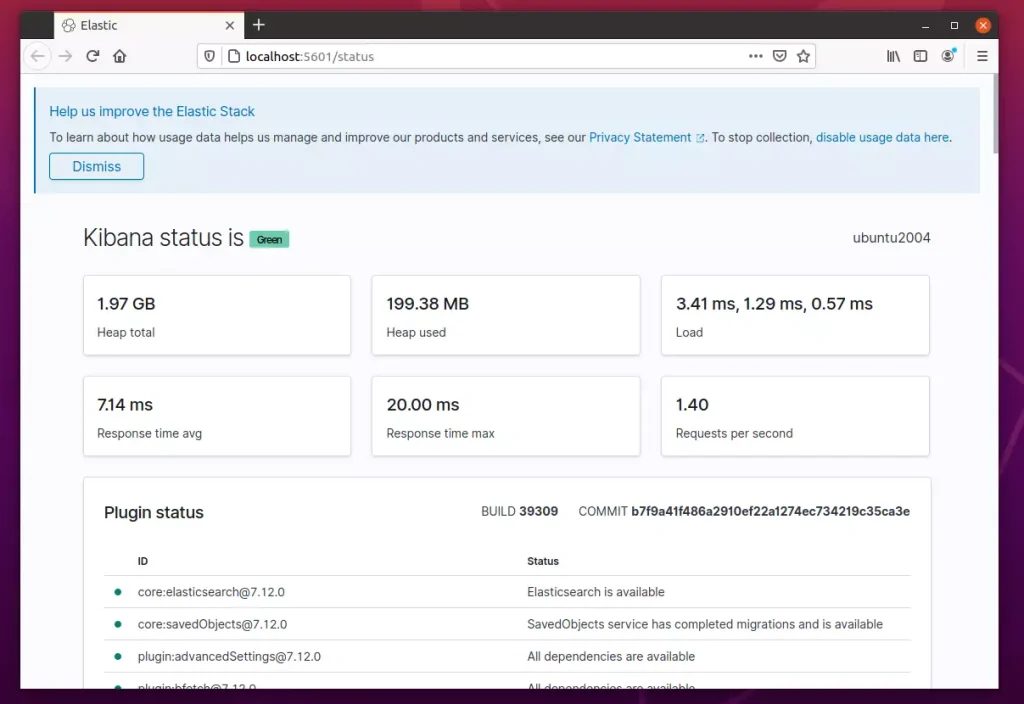
Kibana provides a web interface that can be secured with a reverse proxy and HTTPS. Kibana communicates over port 5601.
http://localhost:5601/status
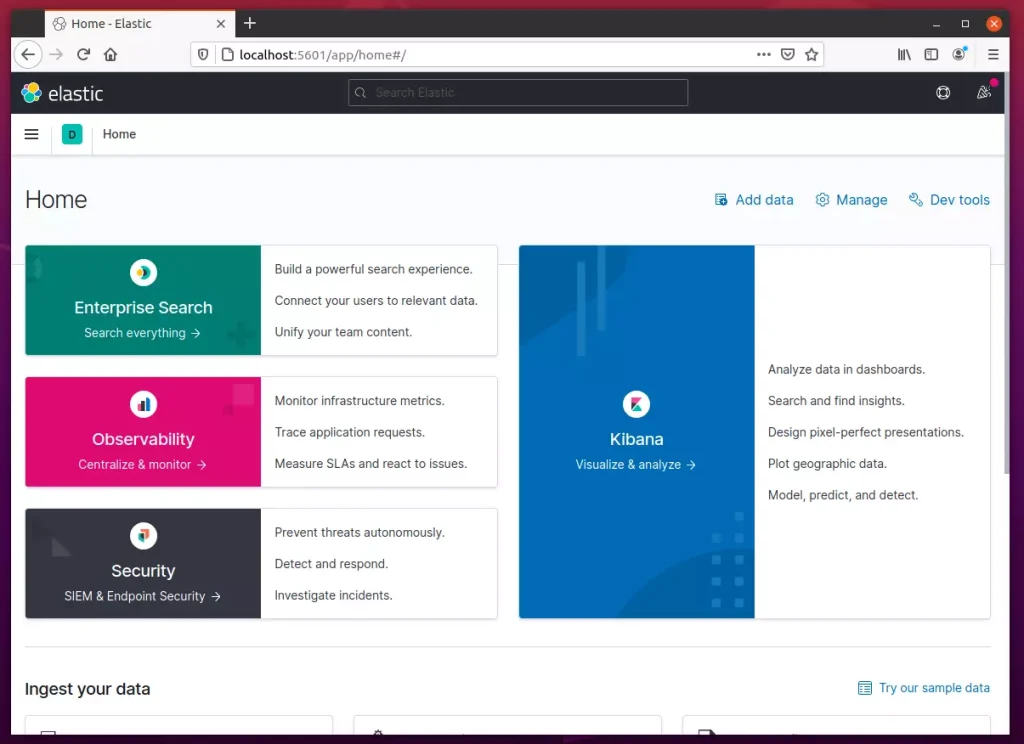
You can open your browser and browse to the server’s hostname or IP address, then port 5601, and bring up the Kibana web interface.
If you’d like to use Nginx reverse proxy and enable HTTPS, then use this Nginx reverse proxy configuration in the virtual host.
server {
    listen 80;
    server_name example.com;
    location / {
        proxy_pass http://localhost:5601;
        proxy_http_version 1.1;
        proxy_set_header Upgrade $http_upgrade;
        proxy_set_header Connection 'upgrade';
        proxy_set_header Host $host;
        proxy_cache_bypass $http_upgrade;
    }
}
You can also use Let’s Encrypt further to secure the Kibana web interface with the proxy above.
Install Logstash
Logstash packages are also available in Ubuntu repositories. So, all you need to do is run the commands below to install, start, and enable its services.
sudo apt install logstash
sudo systemctl start logstash
sudo systemctl enable logstash
That should get Logstash installed and ready to be used. The default configuration of Logstash is found in /etc/logstash/conf.d.
Since we will be using Filebeat to collect and input data to Logstash, run the commands below to create a file to define port 5044 on Logstash.
sudo nano /etc/logstash/conf.d/02-beats-input.conf
Copy and paste the content below into the file and save.
input {
  beats {
    port => 5044
  }
}
Next, create a file to define output to Elasticsearch.
sudo nano /etc/logstash/conf.d/30-elasticsearch-output.conf
Then copy and paste the content below into the file and save it.
output {
  if [@metadata][pipeline] {
    elasticsearch {
    hosts => ["localhost:9200"]
    manage_template => false
    index => "%{[@metadata][beat]}-%{[@metadata][version]}-%{+YYYY.MM.dd}"
    pipeline => "%{[@metadata][pipeline]}"
    }
  } else {
    elasticsearch {
    hosts => ["localhost:9200"]
    manage_template => false
    index => "%{[@metadata][beat]}-%{[@metadata][version]}-%{+YYYY.MM.dd}"
    }
  }
}
Save the exit.
Make sure the configurations are ok by running the validation commands below:
sudo -u logstash /usr/share/logstash/bin/logstash --path.settings /etc/logstash -t
You should get a success message as below:
Configuration OK
Install Filebeat
Filebeat packages also come with Ubuntu default repositories. Simply run the commands below to install, start, and enable Filebeat services.
sudo apt install filebeat
sudo systemctl start filebeat
sudo systemctl enable filebeat
Filebeat is configured to send data directly to Elasticsearch. Since we want data to flow to Logstash before going to Elasticsearch, comment out the lines sent to Elasticsearch and the ones sent to Logstash.
sudo nano /etc/filebeat/filebeat.yml
Make the highlighted changes below:
# Configure what output to use when sending the data collected by the beat.

# ---------------------------- Elasticsearch Output ----------------------------
#output.elasticsearch:
  # Array of hosts to connect to.
#  hosts: ["localhost:9200"]

  # Protocol - either `http` (default) or `https`.
  #protocol: "https"

  # Authentication credentials - either API key or username/password.
  #api_key: "id:api_key"
  #username: "elastic"
  #password: "changeme"

# ------------------------------ Logstash Output -------------------------------
output.logstash:
  # The Logstash hosts
  hosts: ["localhost:5044"]

  # Optional SSL. By default is off.
  # List of root certificates for HTTPS server verifications
After making the changes, save and exit.
Run the commands below to enable Filebeat modules and parsing processes.
sudo filebeat modules enable system
sudo filebeat setup --pipelines --modules system
Load Filebeat template
sudo filebeat setup --index-management -E output.logstash.enabled=false -E 'output.elasticsearch.hosts=["localhost:9200"]'
Also, integrate Filebeat with Kibana.
sudo filebeat setup -E output.logstash.enabled=false -E output.elasticsearch.hosts=['localhost:9200'] -E setup.kibana.host=localhost:5601
Restart all components
sudo systemctl restart elasticsearch
sudo systemctl restart kibana
sudo systemctl restart logstash
sudo systemctl restart filebeat
That should do it!
Conclusion:
This post showed you how to install the ELK stack on Ubuntu 20.04 | 18.04. If you find any error above, please use the form below to report.

Leave a Reply Cancel reply